Running Diabetes: The Guardian versus the Enlite sensors: Test #1
[vc_row padding_top=”0px” padding_bottom=”0px”][vc_column fade_animation_offset=”45px” width=”1/6″][text_output] [/text_output][/vc_column][vc_column fade_animation_offset=”45px” width=”2/3″ id=”” class=”” style=””][text_output]
Ok here is the deal, I upgraded my insulin pump some time ago. Now I have a 670G Medtronic pump. The big deal about this new pump is that it has a new mode call Auto Mode. You can find a little bit of information here and another blogger wrote a fair good excerpt of his experience with the pump on manual mode and auto mode, here. I will not cover or discuss in this post the definitions, differences, features, and description of the new pump. There is plenty on that topic by users and official company information.
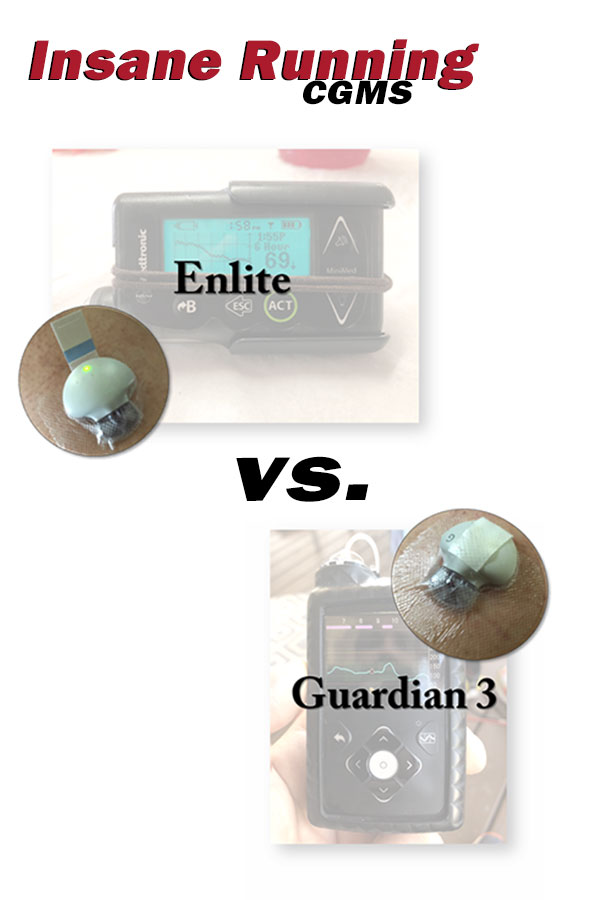
What I would like to share with you is in regard to an experiment that I conducted in regards to the Continuous Glucose Monitoring System (CGMS) readings from the Enlite and the new Guardian 3 sensors. When I upgraded to the new pump I was unable to use the last few Enlite sensors I had due to the compatibility (Not even for Manual mode) So I had this strange opportunity to have my old pump with me to read the values and chart of the Enlite sensor, while also have the Guardian sensor for a comparison.
[/text_output][/vc_column][vc_column fade_animation_offset=”45px” width=”1/6″][/vc_column][/vc_row][vc_row padding_top=”0px” padding_bottom=”0px”][vc_column fade_animation_offset=”45px” width=”1/1″][text_output]

[/text_output][/vc_column][/vc_row][vc_row padding_top=”0px” padding_bottom=”0px”][vc_column fade_animation_offset=”45px” width=”1/6″][text_output] [/text_output][/vc_column][vc_column fade_animation_offset=”45px” width=”2/3″][text_output]
To minimize the variability due to user I did the following:
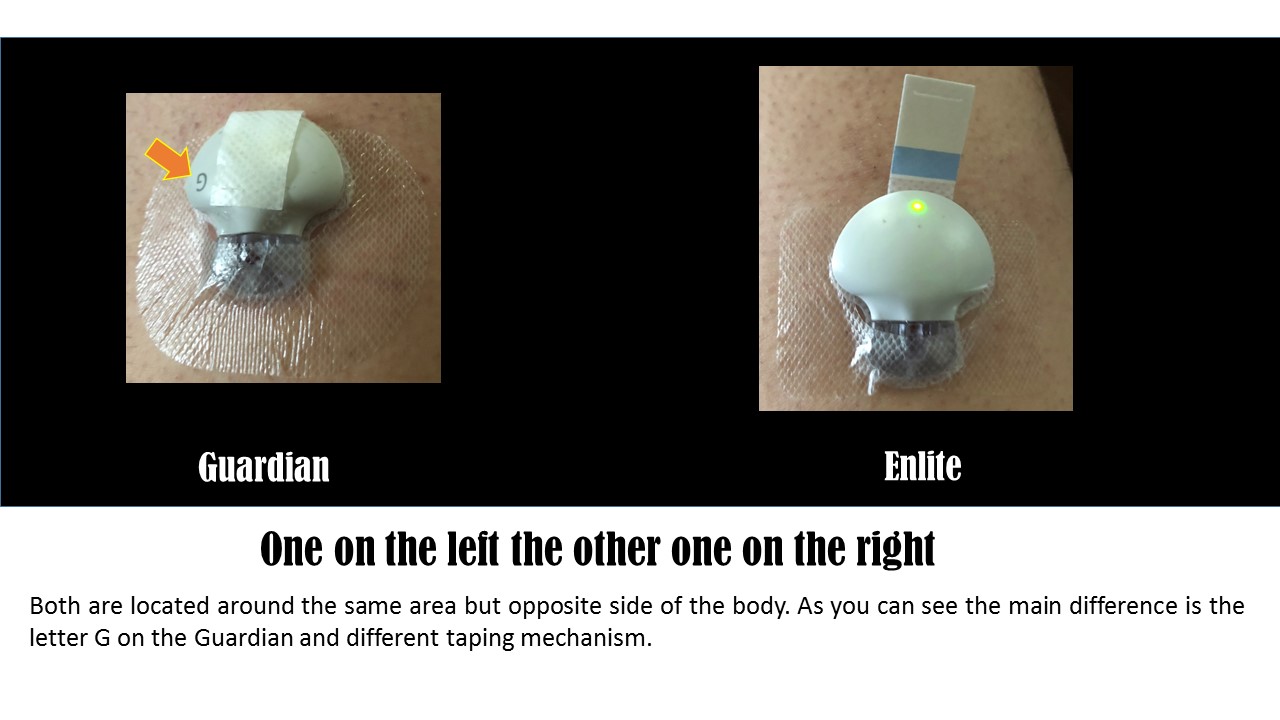
- I wore the sensors on similar areas but opposite sides of my body. (Right and Left upper thigh)
- Every time a sensor needed a calibration I will calibrate both sensors at the same time.
- I will take pictures of the graph with the same time range for better comparison.
I was fortunate to do the experiment two times. I learned a few things from the 1st time when I did the multi-day experiment. But during the second time I was able to collect more detailed information. I will share both of these two experiments data.
[/text_output][/vc_column][vc_column fade_animation_offset=”45px” width=”1/6″][/vc_column][/vc_row][vc_row padding_top=”0px” padding_bottom=”0px”][vc_column fade_animation_offset=”45px” width=”1/1″][text_output]

[/text_output][/vc_column][/vc_row][vc_row padding_top=”0px” padding_bottom=”0px”][vc_column fade_animation_offset=”45px” width=”1/6″][text_output] [/text_output][/vc_column][vc_column fade_animation_offset=”45px” width=”2/3″][text_output]
This was great information to have and see since it provided additional information and confirmation about the reliability of the technology. As I continue throughout the day I can see that I can easily confirm that the trending was very similar to both sensors. Although at times a little bit off, about 20 mg/ml reading difference, still both reading can be used to make decisions. For this 1st multi-day test I was in manual mode with the 670G pump. More on the Auto mode a little bit later.
[/text_output][/vc_column][vc_column fade_animation_offset=”45px” width=”1/6″][/vc_column][/vc_row][vc_row padding_top=”0px” padding_bottom=”0px”][vc_column fade_animation_offset=”45px” width=”1/1″][text_output]

[/text_output][/vc_column][/vc_row][vc_row padding_top=”0px” padding_bottom=”0px”][vc_column fade_animation_offset=”45px” width=”1/6″][text_output] [/text_output][/vc_column][vc_column fade_animation_offset=”45px” width=”2/3″][text_output]
By this time, I am getting very consistent readings and trending information. In the past, I have had sporadic sensor issues with the accuracy of the readings. Those issues caused a larger discrepancy between the glucose meter reading and what the CGMS was displaying. I do not know if the issues are due to the running activities, that causes movement of the sensor or that flow of the surrounding sensor fluid at the sensor site is affected. It does not happen often and normally I am not too worried about that.
[/text_output][/vc_column][vc_column fade_animation_offset=”45px” width=”1/6″][/vc_column][/vc_row][vc_row padding_top=”0px” padding_bottom=”0px”][vc_column fade_animation_offset=”45px” width=”1/1″][text_output] [/text_output][/vc_column][/vc_row][vc_row padding_top=”0px” padding_bottom=”0px”][vc_column fade_animation_offset=”45px” width=”1/6″][text_output]
 [/text_output][/vc_column][vc_column fade_animation_offset=”45px” width=”2/3″][text_output]
I am definitely getting better data trends and smoothness of the graph with the Guardian. Now, I do not know if that is due to the nice display of the 670G pump or if the data is more reliable, allowing for a better continuous graph versus a choppy line that can be seen in the monochrome display from my old pump, especially when a high change ratio/trend is happening.
[/text_output][/vc_column][vc_column fade_animation_offset=”45px” width=”1/6″][/vc_column][/vc_row][vc_row padding_top=”0px” padding_bottom=”0px”][vc_column fade_animation_offset=”45px” width=”1/1″][text_output] [/text_output][/vc_column][/vc_row][vc_row padding_top=”0px” padding_bottom=”0px”][vc_column fade_animation_offset=”45px” width=”1/6″][text_output]
 [/text_output][/vc_column][vc_column fade_animation_offset=”45px” width=”2/3″][text_output]
Alright, alright, I know the previous reading looked really good readings of my daily readings. (At least the days was able to get a screen capture) That last day of the Enlite sensor, basically tested how a high sugar condition looks in both pumps. The Enlite graph has that limitation of 400 max, which it is dangerous and it needs to be treated. Now from my experience, the Enlite sensor will become less reliable as it comes close to the end of the sensor life. As mentioned earlier the Guardian 3 sensor lasted one additional date, before the pump asked for a new sensor.
One thing that did not record during this 1st test, was a comparison of the meter readings (From the calibrations) versus the CGMS readings. Also, there was a large time gap between the pictures. Although the trending was very similar for both sensors there was always a slight difference between the readings. On my second post, I will have more data, pictures of multiple screenshots a day as well as a humble data analysis of the calibration readings.
In conclusion for this 1st test, there was a lot of really good confirmation that the trending matches the expected. The variation during the 1st test was minimal and both sensors are a really good source of information to make adjustments decisions. The Guardian 3 sensor extra day and the excellent graphing display capability of the sensor, pump combo gave the Guardian an extra edge. But in my honest opinion, if you are just planning to use the 670G pump in the manual mode only, I might not be necessary to upgrade to have good glucose controls. Now in the Auto mode, that is a different story, but more on that too on the second part of the experiment.
[/text_output][/vc_column][vc_column fade_animation_offset=”45px” width=”1/6″][/vc_column][/vc_row][vc_row padding_top=”0px” padding_bottom=”0px”][vc_column fade_animation_offset=”45px” width=”1/1″][text_output]
 [/text_output][/vc_column][/vc_row]